

Ya conoces el problema de las campañas de Máximo Rendimiento o de concordancia amplia. Google oculta las consultas de búsqueda reales. Este script las recupera. Se conecta directamente a tu MCC, captura las consultas convertidas y las coloca en una Hoja de Cálculo de Google con el CPA y la tasa de conversión calculados.
Nuestro guión, "Cómo exportar los términos de búsqueda de Google Ads con mejor rendimiento a Hojas de cálculo de Google mediante Apps Script", es perfecto para agencias que gestionan varios clientes o especialistas en marketing que desean dejar de adivinar.
Let’s break it down.

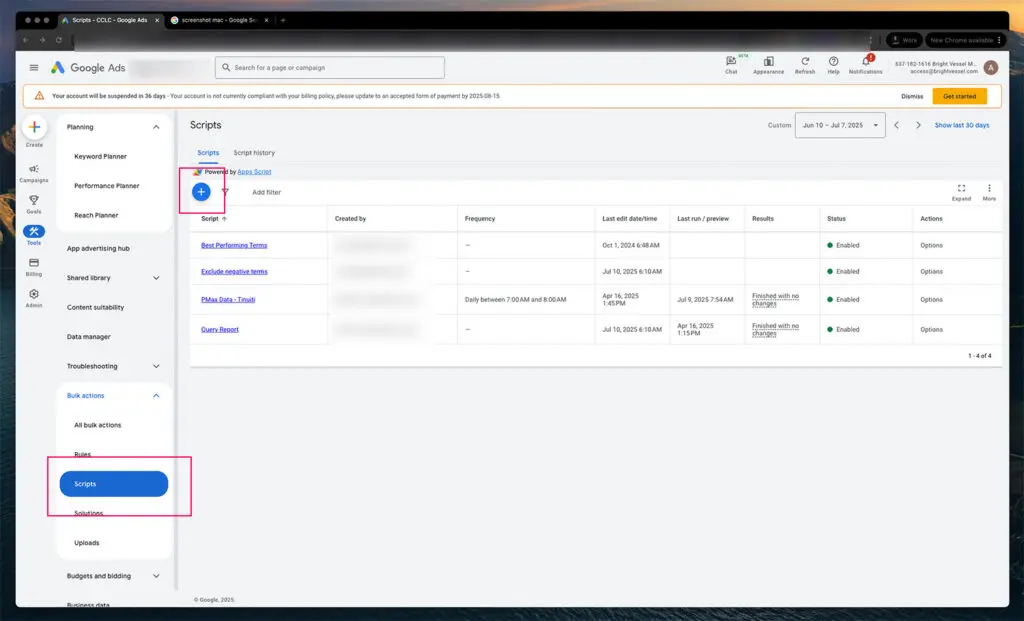
La sección Scripts es donde se configura toda la automatización masiva dentro de Google Ads MCC.
1. Log in to your MCC (Manager Account) and go to Tools > Bulk Actions > Scripts
2. Click the blue plus (+) button to create a new script
Esto abre el editor de scripts. No te preocupes, no estarás programando desde cero. Estarás pegando un script ya escrito. Al hacer clic en este botón, se crea un contenedor de scripts en blanco para tu automatización.

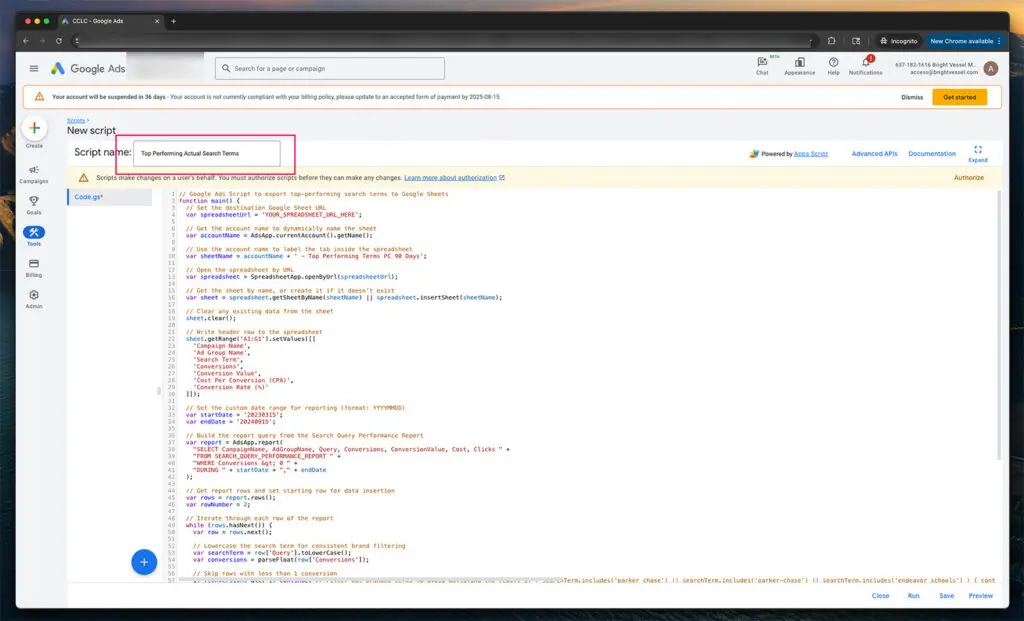
Nombrar su guión es esencial para la gestión y programación a largo plazo.
3. Name the script so it’s easy to identify later
En la parte superior de la ventana del editor de scripts, verá un campo para introducir un nombre. Use algo claro como "Informe de términos de búsqueda con mejor rendimiento". Esto le ayudará a reconocer el script más adelante al administrar varios scripts o cuentas.
You can name it Top Performing Actual Search Terms and drop in the script (included at the bottom of this post).

Nombra el guión
4. Paste the entire script into the editor
function main() {
// Set the destination Google Sheet URL
var spreadsheetUrl = 'Paste Your Google Sheet URL Here';

// Get the account name to dynamically name the sheet
var accountName = AdsApp.currentAccount().getName();

// Use the account name to label the tab inside the spreadsheet
var sheetName = accountName + ' - Top Performing Terms PC 90 Days';

// Open the spreadsheet by URL
var spreadsheet = SpreadsheetApp.openByUrl(spreadsheetUrl);

// Get the sheet by name, or create it if it doesn't exist
var sheet = spreadsheet.getSheetByName(sheetName) || spreadsheet.insertSheet(sheetName);

// Clear any existing data from the sheet
sheet.clear();

// Write header row to the spreadsheet
sheet.getRange('A1').setValue('Campaign Name');
sheet.getRange('B1').setValue('Ad Group Name');
sheet.getRange('C1').setValue('Search Term');
sheet.getRange('D1').setValue('Conversions');
sheet.getRange('E1').setValue('Conversion Value');
sheet.getRange('F1').setValue('Cost Per Conversion (CPA)');
sheet.getRange('G1').setValue('Conversion Rate (%)');

// Set the custom date range for reporting (format: YYYYMMDD)
var startDate = '20230315';
var endDate = '20240915';

// Build the query from the Search Query Performance Report
var report = AdsApp.report(
"SELECT CampaignName, AdGroupName, Query, Conversions, ConversionValue, Cost, Clicks " +
"FROM SEARCH_QUERY_PERFORMANCE_REPORT " +
"WHERE Conversions > 0 " +
"DURING " + startDate + "," + endDate
);

// Get report rows and set starting row for data insertion
var rows = report.rows();
var rowNumber = 2;

// Iterate through each row of the report
while (rows.hasNext()) {
var row = rows.next();

// Lowercase the search term for consistent brand filtering
var searchTerm = row['Query'].toLowerCase();
var conversions = parseFloat(row['Conversions']);

// Skip rows with less than 1 conversion
if (conversions < 1) continue;

// Exclude branded terms to avoid polluting the report
if (searchTerm.includes('parker chase') || searchTerm.includes('parker-chase') || searchTerm.includes('endeavor schools')) {
continue;
}

// Optional generic filter - add or remove terms here
if (
searchTerm.includes('creative') ||
searchTerm.includes('learning') ||
searchTerm.includes('content')
) {
continue;
}

// Extract cost and click values to calculate performance
var cost = parseFloat(row['Cost']);
var clicks = parseFloat(row['Clicks']);

// Calculate cost per conversion (CPA)
var cpa = conversions > 0 ? cost / conversions : 0;

// Calculate conversion rate
var conversionRate = clicks > 0 ? (conversions / clicks) * 100 : 0;

// Format values
cpa = cpa.toFixed(2);
conversionRate = conversionRate.toFixed(2);

// Write the row to the spreadsheet
sheet.getRange(rowNumber, 1).setValue(row['CampaignName']);
sheet.getRange(rowNumber, 2).setValue(row['AdGroupName']);
sheet.getRange(rowNumber, 3).setValue(row['Query']);
sheet.getRange(rowNumber, 4).setValue(conversions);
sheet.getRange(rowNumber, 5).setValue(row['ConversionValue']);
sheet.getRange(rowNumber, 6).setValue('$' + cpa); // Include dollar sign for CPA
sheet.getRange(rowNumber, 7).setValue(conversionRate + '%'); // Add percentage symbol

// Move to the next row in the sheet
rowNumber++;
}

// Log how many rows were processed
Logger.log('Export completed. Total rows processed: ' + (rowNumber - 2));
}The script includes several marked settings you can adjust before running it. These are all inside the script's comment blocks and are meant to be changed based on your specific goals, reporting range, or formatting preferences.
Here’s a breakdown of what you can modify and why:
1. Spreadsheet URL
var spreadsheetUrl = 'https://docs.google.com/spreadsheets/d/xxxxx/edit';What it does:
This is where the script sends your data. Replace the placeholder URL with the link to your Google Sheet. If you're using multiple email addresses, ensure the Sheet is shared with the Google account tied to your MCC.
2. Date Range Settings
var startDate = '20230315';
var endDate = '20240915';
What it does:
This controls the reporting window. Dates must be formatted as YYYYMMDD. You can adjust these to match whatever time frame you're analyzing, the last 30 days, the last 90 days, custom quarterly ranges, etc.
3. Sheet Name Behavior
var sheetName = accountName + ' - Top Performing Terms PC 90 Days';What it does:
This line dynamically names the Sheet tab based on the account running the script. You can change the text string portion ('—Top Performing Terms PC 90 Days') if you want to label reports differently. This is useful when running across multiple brands or sub-accounts.
4. Branded Term Filtering
if (searchTerm.includes('parker chase') || searchTerm.includes('parker-chase') || searchTerm.includes('endeavor schools')) {
continue;
}
What it does:
This section excludes any branded terms from your report. You can update this list by adding or removing .includes() conditions. For example, if you want to exclude “MyBrand,” just add:
|| searchTerm.includes('mybrand')Utilice minúsculas de forma uniforme, ya que el script convierte todas las consultas a minúsculas.
5. Generic Term Filtering
if (
searchTerm.includes('creative') ||
searchTerm.includes('learning') ||
searchTerm.includes('content')
) {
continue;
}
What it does:
This optional filter weeds out terms that aren’t brand-specific but still muddy the data, like “learning” or “creative.” You can add or remove filters here based on what you consider noise.
6. Performance Threshold
if (conversions < 1) continue;What it does:
This line removes queries with no conversions. You can increase this threshold if you want, only for higher-performing terms. For example, change to:
if (conversions < 3) continue;
...to include only search terms with 3+ conversions in the date range.
7. Sheet Output Formatting
sheet.getRange(rowNumber, 6).setValue('$' + cpa);
sheet.getRange(rowNumber, 7).setValue(conversionRate + '%');
What it does:
This controls how CPA and conversion rate are written on the sheet. You can edit or delete the string additions to remove symbols (e.g., $ or %).
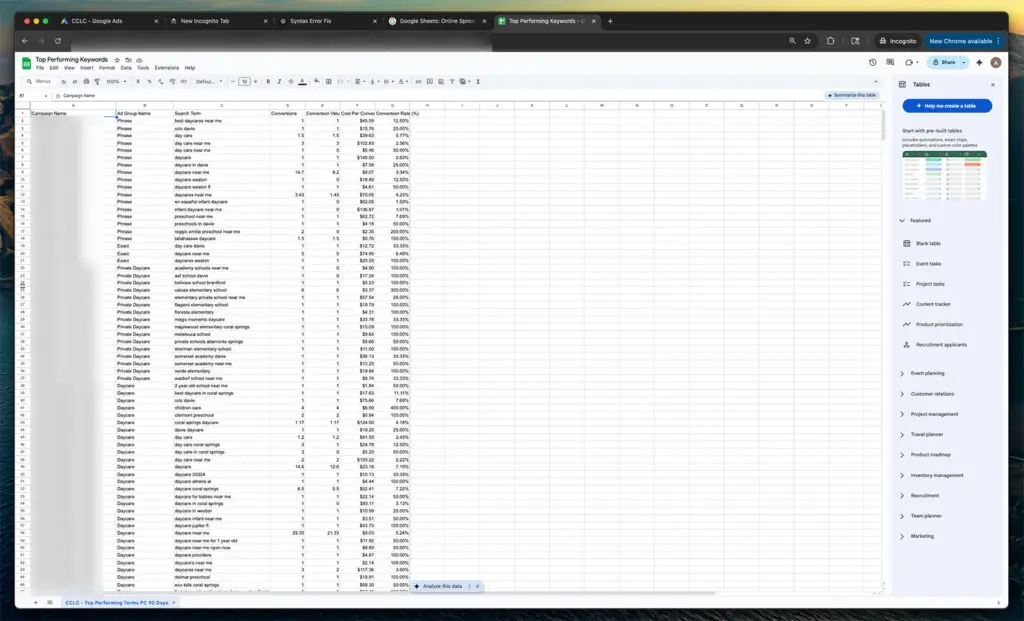
Una vez que el script se ejecute correctamente, se llenará tu Hoja de Cálculo de Google con una tabla estructurada. Cada fila representa un término de búsqueda que generó al menos una conversión dentro del rango de fechas especificado.

El ejemplo de la hoja de cálculo de Google
El script genera un conjunto de columnas de rendimiento en su Hoja de Cálculo de Google, lo que proporciona una visión clara de la contribución de cada término de búsqueda. Estas incluyen los nombres de las campañas y los grupos de anuncios para rastrear dónde se activó el término, el término de búsqueda introducido por el usuario, el número de conversiones generadas, el valor total de conversión, el coste medio por conversión y la tasa de conversión general. Cada campo es fundamental para comprender qué funciona y qué se desperdicia.
Campaign Name
Name of the campaign where the ad was triggered
Ad Group Name
An ad group that matched the search term
Search Term
The exact phrase the user typed into Google
Conversions
Number of tracked conversions from that term
Conversion Value
The total value of those conversions, based on your account settings
Cost Per Conversion (CPA)
The average cost to generate one conversion from that search term
Conversion Rate (%)
Percentage of clicks that resulted in a conversion
This script is a solid foundation, but it can go further depending on how deep you want your reporting to go. If you manage multiple brands or accounts under one MCC, adding campaign labels or filters can help isolate data by brand or business unit. Scheduling the script to run automatically on a weekly or monthly basis saves time and ensures consistent reports. You can build logic to send alerts when key metrics, such as CPA or conversion rate, cross certain thresholds. For more granular analysis, you can combine this with other reports KEYWORDS_PERFORMANCE_REPORT to get match-type breakdowns. Inside the Sheet, adding pivot tables or conditional formatting can surface insights faster. And if you want to go visual, the data can be pulled into Looker Studio for dashboards your clients can understand.
Agregue etiquetas de campaña o filtros a nivel de cuenta para segmentar datos en MCC grandes
Utilice la programación incorporada para automatizar informes semanales o mensuales
Active alertas por correo electrónico cuando el CPA supere un valor específico o la tasa de conversión caiga por debajo de un umbral
Combine datos de otros informes, como KEYWORDS_PERFORMANCE_REPORT, para desglosar los tipos de coincidencia
Agregue resúmenes dinámicos básicos o formato condicional directamente en Hojas de cálculo
Conecte la salida a Looker Studio para obtener paneles de rendimiento visual
En Bright Vessel, creamos herramientas de automatización personalizadas como esta para clientes que necesitan información clara sobre el rendimiento en entornos publicitarios saturados. Si está cansado de revisar paneles deficientes o de realizar cinco exportaciones manuales para obtener los datos que necesita, este script es solo una de las muchas maneras en que agilizamos el proceso.
Consulta nuestro tutorial relacionado sobre “Cómo supervisar el estado de los objetivos de Google Ads en cuentas de MCC con Hojas de cálculo de Google y Apps Script” para conocer otro método para automatizar el seguimiento a escala.
Need a version of this that integrates with Slack, builds Looker dashboards, or connects multiple ad accounts into a master sheet? We can make it. Vamos a hablar.

"*" indicates required fields

"*" indicates required fields

"*" indicates required fields