

Vous connaissez déjà les difficultés rencontrées avec les campagnes Performance Max ou en requête large. Google masque les véritables requêtes de recherche. Ce script les récupère. Il se connecte directement à votre Centre multicompte, récupère les requêtes converties et les dépose dans une feuille de calcul Google Sheets avec calcul du CPA et du taux de conversion.
Notre script, « Comment exporter les termes de recherche Google Ads les plus performants vers Google Sheets à l'aide d'Apps Script », est parfait pour les agences gérant plusieurs clients ou les spécialistes du marketing qui veulent arrêter de deviner.
Let’s break it down.

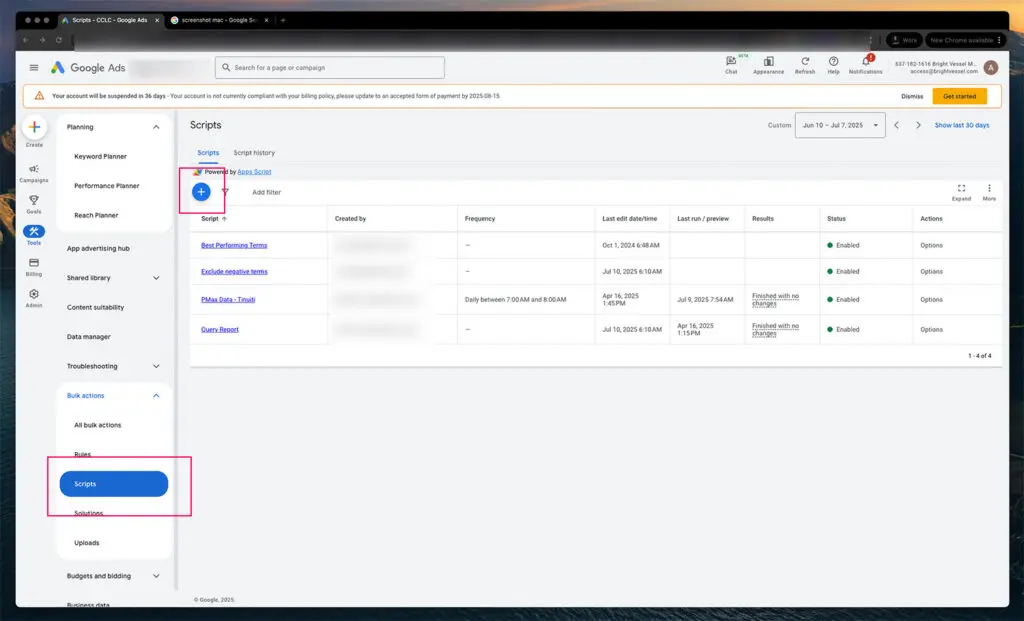
La section Scripts est l'endroit où toute l'automatisation en masse est configurée dans Google Ads MCC.
1. Log in to your MCC (Manager Account) and go to Tools > Bulk Actions > Scripts
2. Click the blue plus (+) button to create a new script
Cela ouvre l'éditeur de script. Pas d'inquiétude, vous ne coderez pas de zéro. Vous collerez un script déjà écrit. Cliquer sur ce bouton crée un conteneur de script vierge pour votre automatisation.

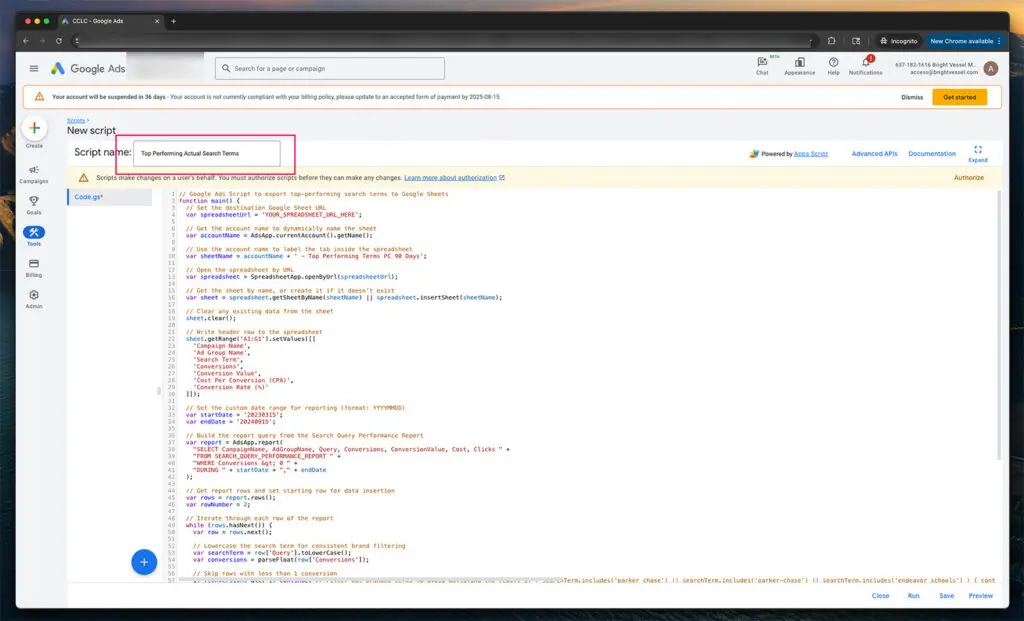
Nommer votre script est essentiel pour la gestion et la planification à long terme.
3. Name the script so it’s easy to identify later
En haut de la fenêtre de l'éditeur de script, vous trouverez un champ permettant de saisir un nom. Utilisez une option claire, comme « Rapport sur les termes de recherche les plus performants ». Cela vous permettra de reconnaître le script plus facilement lors de la gestion de plusieurs scripts ou comptes.
You can name it Top Performing Actual Search Terms and drop in the script (included at the bottom of this post).

Nommez le script
4. Paste the entire script into the editor
function main() {
// Set the destination Google Sheet URL
var spreadsheetUrl = 'Paste Your Google Sheet URL Here';

// Get the account name to dynamically name the sheet
var accountName = AdsApp.currentAccount().getName();

// Use the account name to label the tab inside the spreadsheet
var sheetName = accountName + ' - Top Performing Terms PC 90 Days';

// Open the spreadsheet by URL
var spreadsheet = SpreadsheetApp.openByUrl(spreadsheetUrl);

// Get the sheet by name, or create it if it doesn't exist
var sheet = spreadsheet.getSheetByName(sheetName) || spreadsheet.insertSheet(sheetName);

// Clear any existing data from the sheet
sheet.clear();

// Write header row to the spreadsheet
sheet.getRange('A1').setValue('Campaign Name');
sheet.getRange('B1').setValue('Ad Group Name');
sheet.getRange('C1').setValue('Search Term');
sheet.getRange('D1').setValue('Conversions');
sheet.getRange('E1').setValue('Conversion Value');
sheet.getRange('F1').setValue('Cost Per Conversion (CPA)');
sheet.getRange('G1').setValue('Conversion Rate (%)');

// Set the custom date range for reporting (format: YYYYMMDD)
var startDate = '20230315';
var endDate = '20240915';

// Build the query from the Search Query Performance Report
var report = AdsApp.report(
"SELECT CampaignName, AdGroupName, Query, Conversions, ConversionValue, Cost, Clicks " +
"FROM SEARCH_QUERY_PERFORMANCE_REPORT " +
"WHERE Conversions > 0 " +
"DURING " + startDate + "," + endDate
);

// Get report rows and set starting row for data insertion
var rows = report.rows();
var rowNumber = 2;

// Iterate through each row of the report
while (rows.hasNext()) {
var row = rows.next();

// Lowercase the search term for consistent brand filtering
var searchTerm = row['Query'].toLowerCase();
var conversions = parseFloat(row['Conversions']);

// Skip rows with less than 1 conversion
if (conversions < 1) continue;

// Exclude branded terms to avoid polluting the report
if (searchTerm.includes('parker chase') || searchTerm.includes('parker-chase') || searchTerm.includes('endeavor schools')) {
continue;
}

// Optional generic filter - add or remove terms here
if (
searchTerm.includes('creative') ||
searchTerm.includes('learning') ||
searchTerm.includes('content')
) {
continue;
}

// Extract cost and click values to calculate performance
var cost = parseFloat(row['Cost']);
var clicks = parseFloat(row['Clicks']);

// Calculate cost per conversion (CPA)
var cpa = conversions > 0 ? cost / conversions : 0;

// Calculate conversion rate
var conversionRate = clicks > 0 ? (conversions / clicks) * 100 : 0;

// Format values
cpa = cpa.toFixed(2);
conversionRate = conversionRate.toFixed(2);

// Write the row to the spreadsheet
sheet.getRange(rowNumber, 1).setValue(row['CampaignName']);
sheet.getRange(rowNumber, 2).setValue(row['AdGroupName']);
sheet.getRange(rowNumber, 3).setValue(row['Query']);
sheet.getRange(rowNumber, 4).setValue(conversions);
sheet.getRange(rowNumber, 5).setValue(row['ConversionValue']);
sheet.getRange(rowNumber, 6).setValue('$' + cpa); // Include dollar sign for CPA
sheet.getRange(rowNumber, 7).setValue(conversionRate + '%'); // Add percentage symbol

// Move to the next row in the sheet
rowNumber++;
}

// Log how many rows were processed
Logger.log('Export completed. Total rows processed: ' + (rowNumber - 2));
}The script includes several marked settings you can adjust before running it. These are all inside the script's comment blocks and are meant to be changed based on your specific goals, reporting range, or formatting preferences.
Here’s a breakdown of what you can modify and why:
1. Spreadsheet URL
var spreadsheetUrl = 'https://docs.google.com/spreadsheets/d/xxxxx/edit';What it does:
This is where the script sends your data. Replace the placeholder URL with the link to your Google Sheet. If you're using multiple email addresses, ensure the Sheet is shared with the Google account tied to your MCC.
2. Date Range Settings
var startDate = '20230315';
var endDate = '20240915';
What it does:
This controls the reporting window. Dates must be formatted as YYYYMMDD. You can adjust these to match whatever time frame you're analyzing, the last 30 days, the last 90 days, custom quarterly ranges, etc.
3. Sheet Name Behavior
var sheetName = accountName + ' - Top Performing Terms PC 90 Days';What it does:
This line dynamically names the Sheet tab based on the account running the script. You can change the text string portion ('—Top Performing Terms PC 90 Days') if you want to label reports differently. This is useful when running across multiple brands or sub-accounts.
4. Branded Term Filtering
if (searchTerm.includes('parker chase') || searchTerm.includes('parker-chase') || searchTerm.includes('endeavor schools')) {
continue;
}
What it does:
This section excludes any branded terms from your report. You can update this list by adding or removing .includes() conditions. For example, if you want to exclude “MyBrand,” just add:
|| searchTerm.includes('mybrand')Utilisez les minuscules de manière cohérente puisque le script convertit toutes les requêtes en minuscules.
5. Generic Term Filtering
if (
searchTerm.includes('creative') ||
searchTerm.includes('learning') ||
searchTerm.includes('content')
) {
continue;
}
What it does:
This optional filter weeds out terms that aren’t brand-specific but still muddy the data, like “learning” or “creative.” You can add or remove filters here based on what you consider noise.
6. Performance Threshold
if (conversions < 1) continue;What it does:
This line removes queries with no conversions. You can increase this threshold if you want, only for higher-performing terms. For example, change to:
if (conversions < 3) continue;
...to include only search terms with 3+ conversions in the date range.
7. Sheet Output Formatting
sheet.getRange(rowNumber, 6).setValue('$' + cpa);
sheet.getRange(rowNumber, 7).setValue(conversionRate + '%');
What it does:
This controls how CPA and conversion rate are written on the sheet. You can edit or delete the string additions to remove symbols (e.g., $ or %).
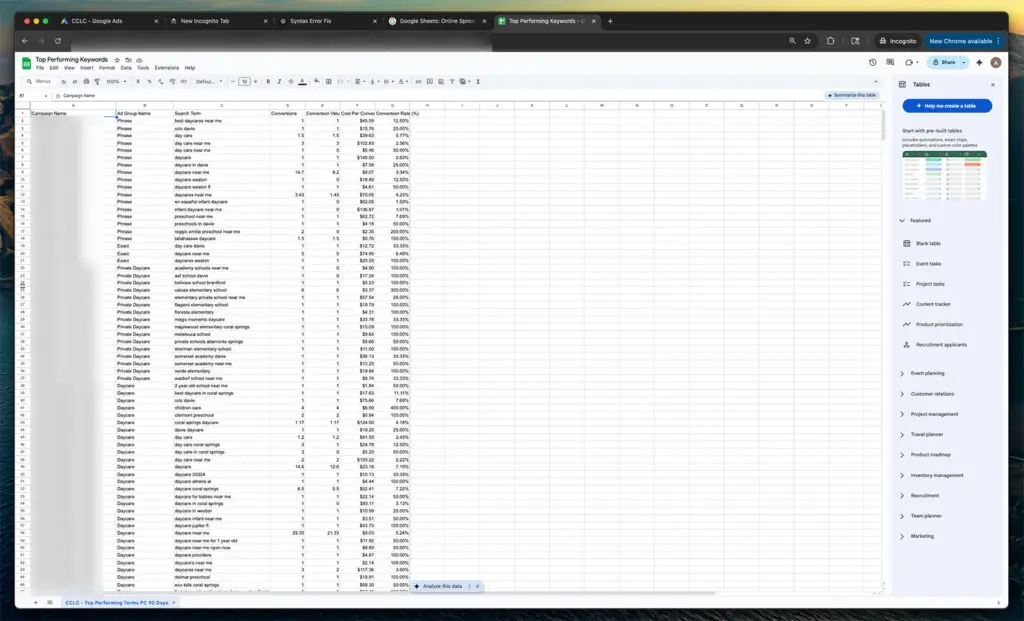
Une fois le script exécuté, un tableau structuré sera généré dans votre feuille Google Sheets. Chaque ligne représente un terme de recherche ayant généré au moins une conversion au cours de la période spécifiée.

L'exemple de la feuille Google
Le script génère un ensemble de colonnes de performance dans votre feuille Google Sheets, offrant une vue claire de la contribution de chaque terme de recherche. Ces colonnes incluent les noms de campagne et de groupe d'annonces pour le suivi de l'origine du terme, le terme de recherche saisi par l'utilisateur, le nombre de conversions générées, la valeur totale de conversion, le coût moyen par conversion et le taux de conversion global. Chaque champ est essentiel pour comprendre ce qui fonctionne et ce qui est inutile.
Campaign Name
Name of the campaign where the ad was triggered
Ad Group Name
An ad group that matched the search term
Search Term
The exact phrase the user typed into Google
Conversions
Number of tracked conversions from that term
Conversion Value
The total value of those conversions, based on your account settings
Cost Per Conversion (CPA)
The average cost to generate one conversion from that search term
Conversion Rate (%)
Percentage of clicks that resulted in a conversion
This script is a solid foundation, but it can go further depending on how deep you want your reporting to go. If you manage multiple brands or accounts under one MCC, adding campaign labels or filters can help isolate data by brand or business unit. Scheduling the script to run automatically on a weekly or monthly basis saves time and ensures consistent reports. You can build logic to send alerts when key metrics, such as CPA or conversion rate, cross certain thresholds. For more granular analysis, you can combine this with other reports KEYWORDS_PERFORMANCE_REPORT to get match-type breakdowns. Inside the Sheet, adding pivot tables or conditional formatting can surface insights faster. And if you want to go visual, the data can be pulled into Looker Studio for dashboards your clients can understand.
Ajoutez des étiquettes de campagne ou des filtres au niveau du compte pour segmenter les données sur de grands MCC
Utilisez la planification intégrée pour automatiser les rapports hebdomadaires ou mensuels
Déclenchez des alertes par e-mail lorsque le CPA dépasse une valeur spécifique ou que le taux de conversion tombe en dessous d'un seuil
Rejoignez les données d'autres rapports, comme KEYWORDS_PERFORMANCE_REPORT pour décomposer les types de correspondance
Ajoutez des résumés de pivot de base ou une mise en forme conditionnelle directement dans Sheets
Connectez la sortie à Looker Studio pour des tableaux de bord de performances visuelles
Chez Bright Vessel, nous développons des outils d'automatisation personnalisés comme celui-ci pour nos clients qui ont besoin d'analyses de performance claires dans des environnements publicitaires encombrés. Si vous en avez assez de fouiller dans des tableaux de bord médiocres ou d'effectuer cinq exportations manuelles pour obtenir les données dont vous avez besoin, ce script n'est qu'une des nombreuses façons dont nous simplifions le processus.
Consultez notre procédure pas à pas associée sur « Comment surveiller l’état des objectifs Google Ads sur les comptes MCC à l’aide de Google Sheets et d’Apps Script » pour une autre méthode permettant d’automatiser le suivi à grande échelle.
Need a version of this that integrates with Slack, builds Looker dashboards, or connects multiple ad accounts into a master sheet? We can make it. Parlons-en.

"*" indicates required fields

"*" indicates required fields

"*" indicates required fields